Free Template · from the makers of NominalQC, QC software for small manufacturers
Free SPC control chart templates for Excel
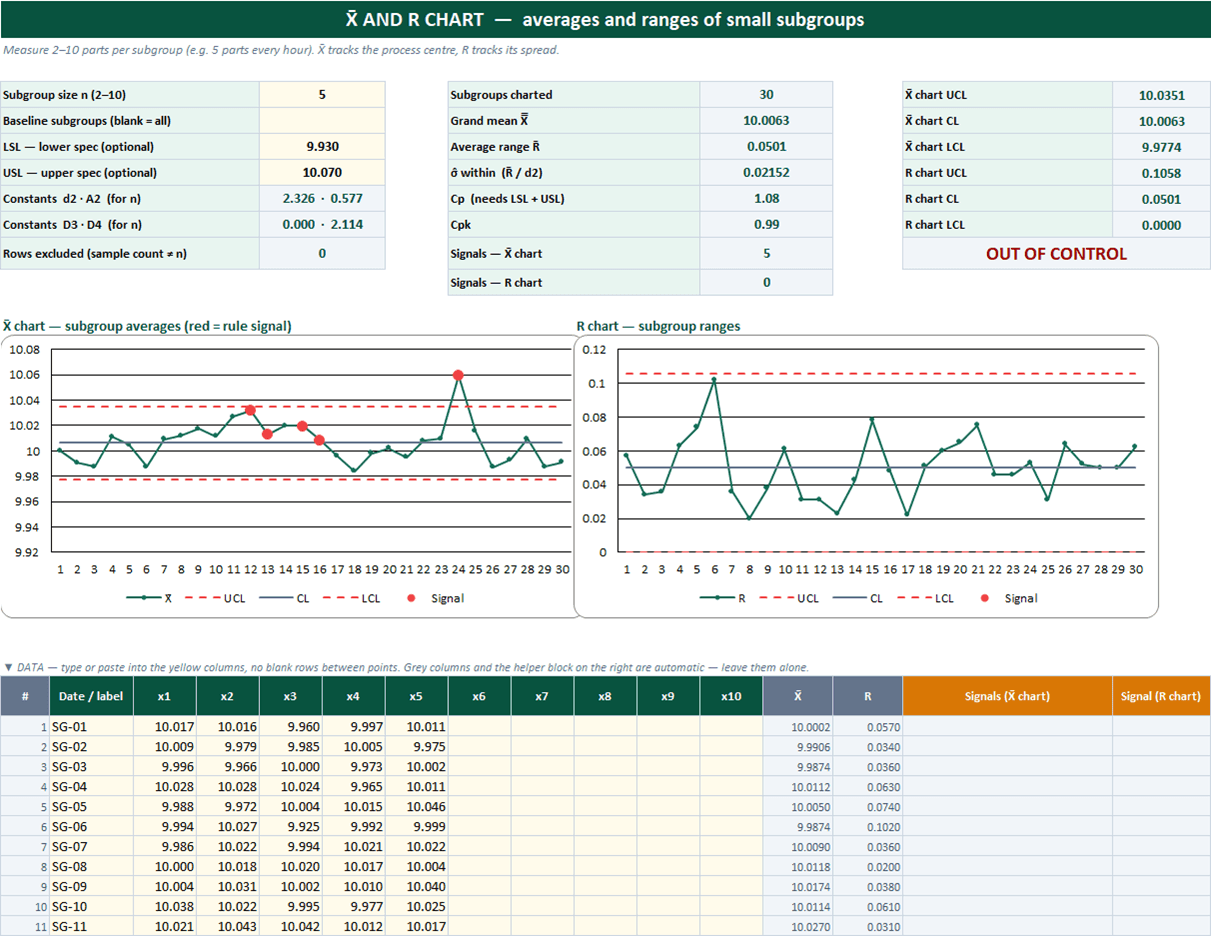
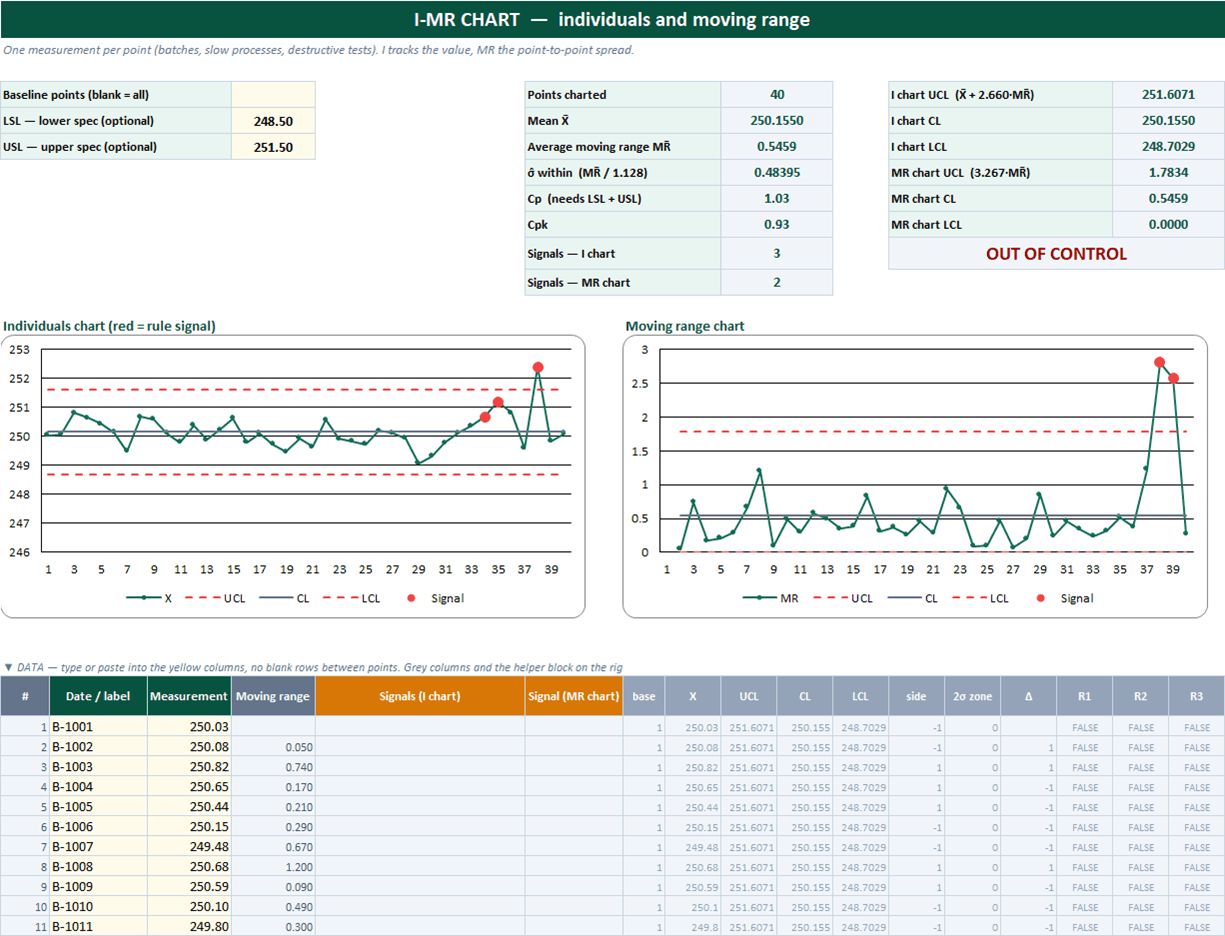
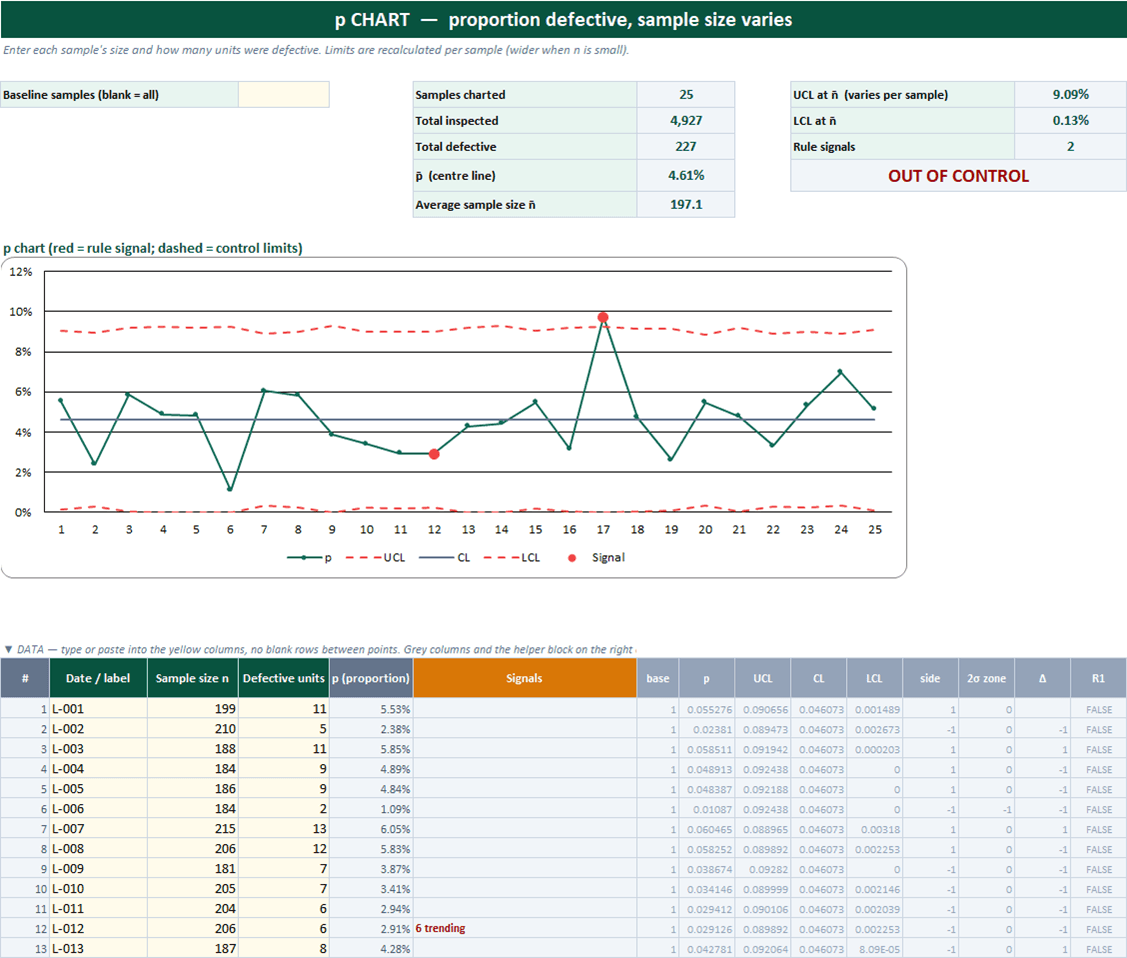
Statistical process control without the formula archaeology: pick the sheet, paste your data, and the centre line, 3σ limits, run-rule signals, and verdict fill in. Six charts — X̄-R and I-MR for measurements, p / np / c / u for counts — plus a "which chart do I use?" table, an optional frozen baseline, and Cp/Cpk when you add spec limits.
Related: Cp/Cpk calculator (Excel template) — full capability study
Free Excel template — no email, no signup.
This log, without the spreadsheet
NominalQC draws X̄-R and I-MR charts and Cp/Cpk live from the measurements your team already records — it picks the chart for you, flags out-of-limit points, and prints a document-style SPC report.
Try the live demoOpens on the real app with seeded data · no signup, no email · read-only · free for one user when you’re ready.
Prefer it in your inbox, with two short notes on using it?
What’s in the download
- Six chart sheets: X̄-R (subgroups of 2–10, up to 100 subgroups), I-MR (300 readings), and p, np, c, u attribute charts (100 samples each)
- Centre line and 3σ limits calculated automatically from the standard constants (d2, A2, D3, D4, c4 … on the CONSTANTS sheet); p and u limits recalculated per sample when the sample size varies
- Four out-of-control rules on every chart: beyond 3σ, 9 in a row on one side, 6 steadily trending, 2 of 3 beyond 2σ — R and MR charts use the 3σ rule
- Every flagged point explained in a Signals column and marked red on the chart, with an IN CONTROL / OUT OF CONTROL verdict card per sheet
- Optional baseline: freeze the limits on the first K points and judge new data against them — the way a chart is run once the process is characterised
- Optional LSL / USL on the X̄-R and I-MR sheets → Cp and Cpk, kept separate from the control limits
- Subgroup-size dropdown on X̄-R; rows whose sample count doesn’t match are excluded and labelled, never silently averaged
- 100% macro-free — works in Excel 2010+ on Windows and Mac, no security prompts
You get the workbook (.xlsx) — its Instructions sheet is the quick-start. Every sheet ships with sample data that includes planted signals so you can see the rules fire — paste your own data over it.
Where this spreadsheet breaks
A control chart in Excel does the statistics correctly. What it can’t do is keep itself current:
1.The chart is only as current as the last paste
Measurements are written on a checksheet, typed into the workbook at the end of the shift — or the week. The signal fired hours ago; the chart finds out on Friday.
NominalQC computes X̄-R and I-MR charts live from the inspection measurements your team already records against the plan — no export, no paste, no lag.
2.One characteristic per sheet
A real part has a dozen dimensions and a shop has dozens of parts. Nobody maintains sixty control charts in Excel, so most characteristics simply aren’t charted.
NominalQC charts every measured characteristic on every part continuously and picks X̄-R or I-MR for you based on how the data was collected — selectable in two clicks.
3.The customer wants the study, not the workbook
When an auditor or customer asks for evidence of control and capability, someone screenshots the chart into a Word doc and retypes the numbers.
NominalQC prints a document-style SPC report — captioned chart figures, capability table (Cp/Cpk/Pp/Ppk), and histogram against the spec limits — from the same live data.
Who built this
I spent 16 years in manufacturing quality — machining, fabrication, assembly — and in every shop I ended up building the same Excel tools with macros because the software budget went elsewhere. These workbooks are the ones I kept rebuilding. Eventually I stopped rebuilding spreadsheets and built NominalQC instead — but the spreadsheet is still the right starting point for a lot of shops, so here they are, cleaned up and free.
Questions
Is it really free?
Yes. Click Download and the full workbook is yours — no email, no signup, no card. If you would rather have it sent to your inbox, there is an optional email link under the button; that path adds two short follow-up emails about running the process, then silence — unsubscribe anytime.
Does it work on Mac or older Excel?
Yes — this workbook is 100% macro-free, so there’s no "Enable Content" prompt and it works in Excel 2010 or later on Windows and Mac.
Which chart should I use?
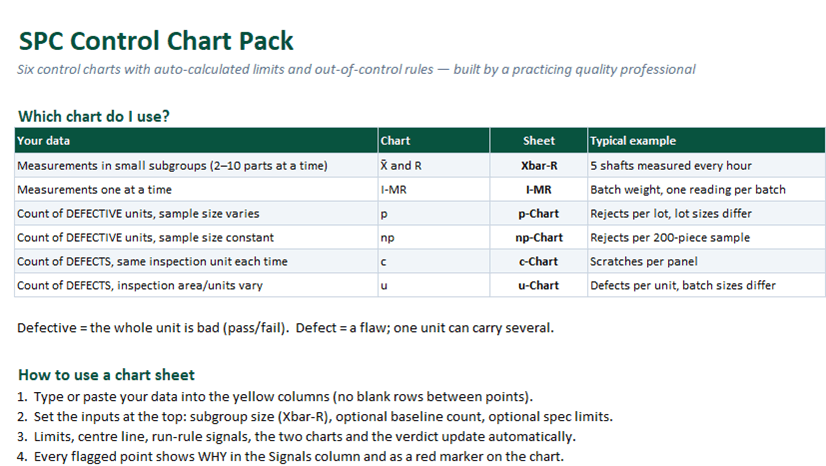
Measurements taken a few at a time (say 5 parts every hour) → X̄-R. Measurements one at a time (one batch weight per batch) → I-MR. Counting defective units — the whole part is bad — use p when the sample size varies and np when it’s constant. Counting defects — one part can carry several — use c when the inspection unit is the same each time and u when it varies. The Instructions sheet has this as a table with examples.
What’s the difference between control limits and spec limits?
Control limits come from the process: ±3σ around the centre line, calculated from your own data, telling you whether the process is behaving consistently. Spec limits come from the customer or the drawing, telling you whether parts are acceptable. A process can be in control and still make bad parts, or out of control while every part passes. The workbook never mixes them — control limits drive the signals; LSL/USL only feed Cp/Cpk.
When should I freeze the baseline?
Once you have 20–25 points from a stable process, enter that count as the Baseline. The limits are then calculated from those points only, and every new point is judged against them — which is how a control chart is meant to be run in production. Leave it blank while you’re still characterising the process, and recalculate after a deliberate process change.
More free templates
Ready to skip the spreadsheet stage?
Inspections, NCRs, CAPAs, LPAs, and gauge calibration — free for one user, team plans from $59/month flat.
Create your free account