Free Template · from the makers of NominalQC, QC software for small manufacturers
Free Cp/Cpk calculator (Excel template)
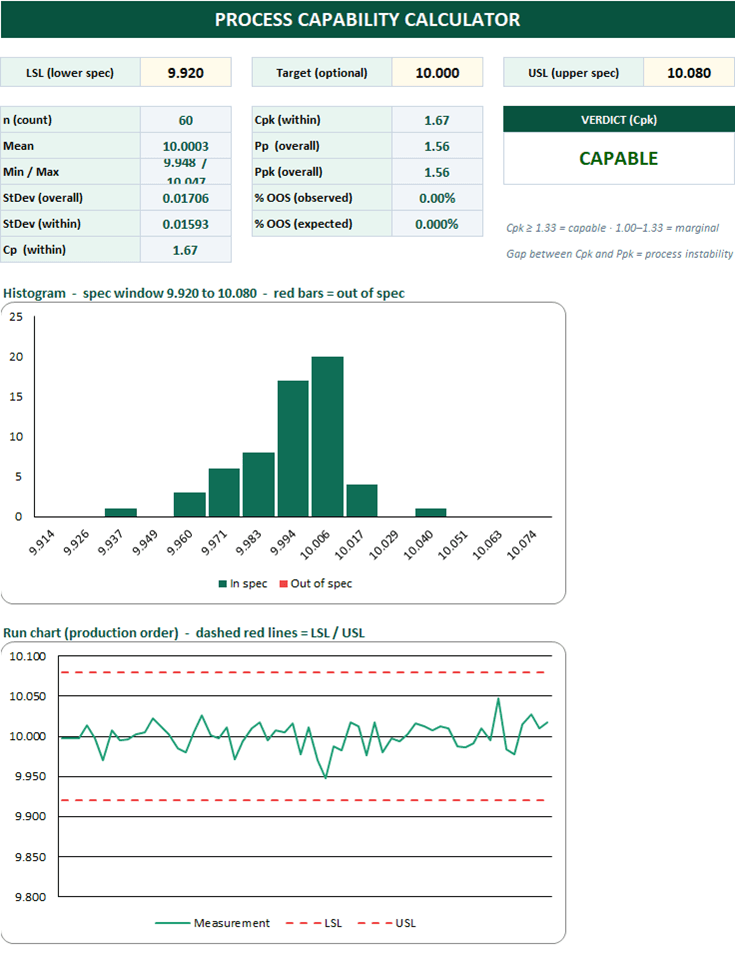
A process capability study without the statistics homework: paste your measurements, type the spec limits, and read the verdict. Within-process Cp/Cpk (the I-MR moving-range method), overall Pp/Ppk, expected and observed % out of spec, a histogram that turns out-of-spec bars red, and a run chart with the spec limits drawn on.
Calculate it here
Nothing you paste leaves your browser.
Result
CAPABLE- n
- 20
- Mean
- 0.5000
- σ within (I-MR)
- 0.00021
- σ overall
- 0.00019
- Cp
- 3.11
- Cpk
- 3.04
- Pp
- 3.50
- Ppk
- 3.42
- Out of spec
- 0 of 20
- Min / Max
- 0.4997 / 0.5004
Cp/Cpk use within-process variation (average moving range ÷ 1.128, the I-MR estimate); Pp/Ppk use overall variation. A wide gap between Cpk and Ppk means the process drifts between readings. Verdict thresholds: 1.33 capable, 1.00 marginal. Check the histogram in the workbook before trusting any index on a non-normal process.
Free Excel template — no email, no signup.
This log, without the spreadsheet
NominalQC computes X̄-R, I-MR, and Cp/Cpk live from the measurements your team already records — no exports, no pasting, no formula babysitting.
Try the live demoOpens on the real app with seeded data · no signup, no email · read-only · free for one user when you’re ready.
Prefer it in your inbox, with two short notes on using it?
What’s in the download
- Paste up to 500 measurements — n, mean, min/max, and both standard deviations compute live
- Cp and Cpk from within-process variation (average moving range ÷ 1.128 — the same estimate an I-MR control chart uses)
- Pp and Ppk from overall variation, so the Cpk-vs-Ppk gap exposes instability
- Observed % out of spec (counted) and expected % out of spec (from the normal model)
- Color-coded verdict: CAPABLE (≥1.33) / MARGINAL / NOT CAPABLE — thresholds explained on the sheet
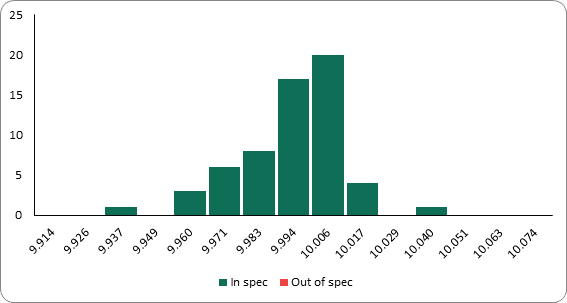
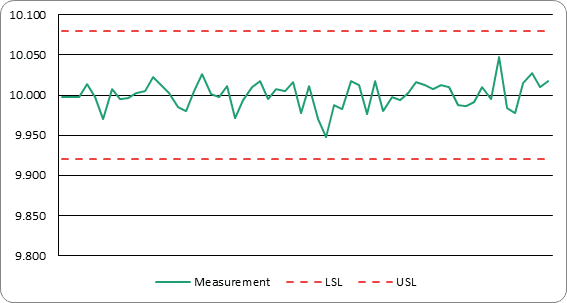
- Histogram with out-of-spec bars in red, and a run chart with dashed LSL/USL lines that resize to your data
- 100% macro-free — works in Excel 2010+ on Windows and Mac, no security prompts
You get the workbook (.xlsx) — its Instructions sheet is the quick-start. Sample data is included — paste your measurements over it.
Where this spreadsheet breaks
A calculator answers "were we capable last month?" It can’t answer "are we drifting right now?":
1.Capability is a rear-view mirror
By the time someone exports data and pastes it into the calculator, the process has been drifting for weeks. The number is honest — and late.
NominalQC computes SPC charts and capability live from the inspection measurements your team already records — no export, no paste, no lag.
2.The data entry is the weak link
Measurements live on paper checksheets or scattered files. The paste-into-Excel step is where transcription errors and cherry-picking sneak in.
In NominalQC measurements are captured once, on the inspection form, against the plan — and the same numbers feed the SPC charts untouched.
3.One characteristic at a time
The calculator holds one dimension. A real part has twenty — and nobody re-pastes twenty datasets a week.
NominalQC tracks every characteristic on every part continuously, with X̄-R and I-MR charts and capability per characteristic, selectable in two clicks.
Who built this
I spent 16 years in manufacturing quality — machining, fabrication, assembly — and in every shop I ended up building the same Excel tools with macros because the software budget went elsewhere. These workbooks are the ones I kept rebuilding. Eventually I stopped rebuilding spreadsheets and built NominalQC instead — but the spreadsheet is still the right starting point for a lot of shops, so here they are, cleaned up and free.
Questions
Is it really free?
Yes. Click Download and the full workbook is yours — no email, no signup, no card. If you would rather have it sent to your inbox, there is an optional email link under the button; that path adds two short follow-up emails about running the process, then silence — unsubscribe anytime.
Does it work on Mac or older Excel?
Yes — this workbook is 100% macro-free, so there’s no "Enable Content" prompt and it works in Excel 2010 or later on Windows and Mac.
What’s the difference between Cpk and Ppk?
Cpk uses within-process variation (estimated from consecutive-point moving ranges) — what the process is capable of when stable. Ppk uses overall variation across all the data — how it actually performed, drift included. A big gap between them means the process wanders: the machine could do it, but something (setups, shifts, material lots) keeps moving the aim.
How many measurements do I need?
More is better: 30 is a common minimum for a rough read, 50–100+ for numbers you’d show a customer. Below ~25 the estimates get noisy — treat them as directional. And check the histogram first: if the shape isn’t roughly normal, the indices can mislead regardless of sample size.
More free templates
Ready to skip the spreadsheet stage?
Inspections, NCRs, CAPAs, LPAs, and gauge calibration — free for one user, team plans from $59/month flat.
Create your free account