Pro Template · from the makers of NominalQC, QC software for small manufacturers
SPC & Capability Pro Template (Excel)
One log for every characteristic, X̄-R, X̄-S or I-MR charts with limits per phase and all eight Nelson rules, and a capability study that prints: Cp, Cpk, Pp, Ppk, Cpm, a 95 % confidence interval and a normality test.
Who it is for: The quality engineer who already runs the free SPC pack and Cp/Cpk calculator and has outgrown one characteristic per sheet, four rules and a single frozen baseline.
Control charts, run rules, phases and the capability study
$19one-time
- Light and dark editions in the download
- Macro-free: Excel 2010+, Mac, LibreOffice
- Sample records from a machine shop, type over them
- Your receipt re-downloads the latest build
One-time payment, no subscription. Card handled by Stripe.
Or all three templates for $49, saves $8: the bundle.
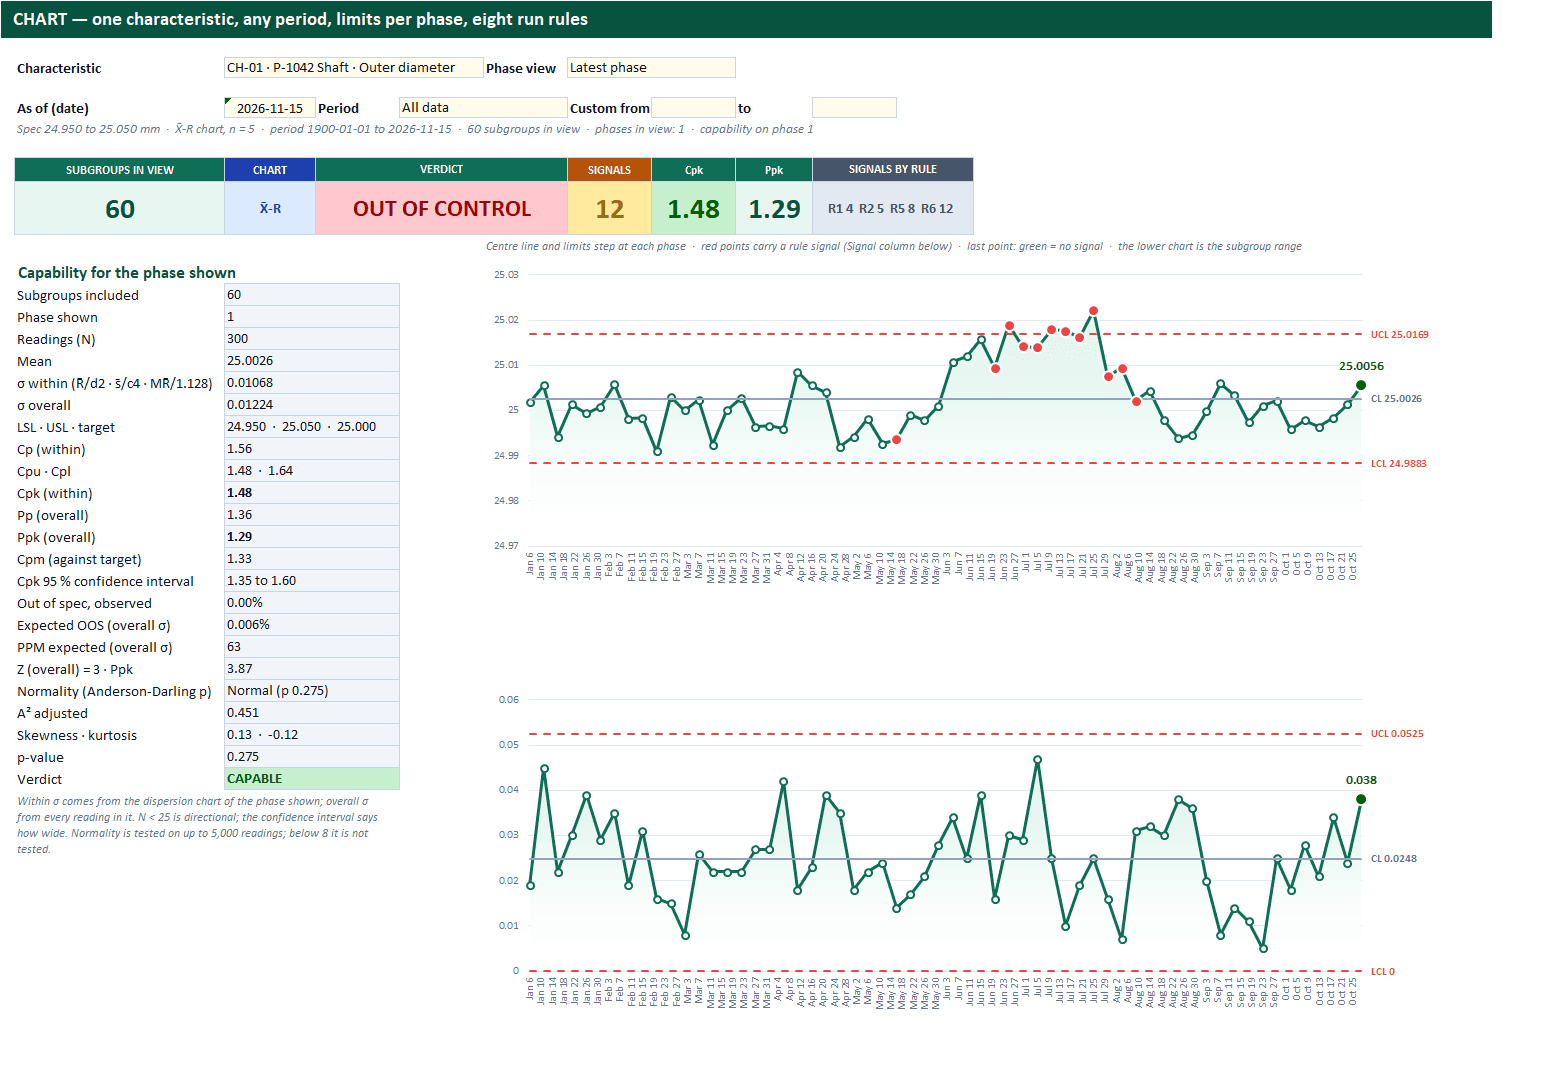
CHART: pick the characteristic, period and phase; X-bar and R (or s, or individuals and MR) with limits per phase, the eight rules in words, and the capability panel.
Every sheet, up close
11 captures from the workbook you download, taken in Excel with the sample records in. Click any one for the full-size view, then “Actual size” to read the cells; the arrow keys move between sheets. The light edition is shown; the dark edition is the same workbook.
What’s in the download
CONFIG
Up to 24 characteristics: part, unit, nominal, LSL, USL, readings per subgroup (1 to 25), chart type (Auto, X̄-R, X̄-S, I-MR), gauge, owner and up to three phase start dates. Eight rule switches, target and marginal Cpk, the lists behind every dropdown.
DATA LOG
1,000 subgroups of up to 25 readings with date, lot, machine, shift, operator and the characteristic from a dropdown. n, X̄, R and s are formulas; a row whose reading count does not match its characteristic is flagged and left out, never averaged; readings outside the specification turn red as you type.
CHART
Pick the characteristic, the period (all, last 30 or 90 days, last 12 months, calendar or fiscal year to date, custom dates) and the phase view. Centre line and 3σ limits per phase, the eight Nelson rules switchable one by one, every signal named in words, and a capability panel: Cp, Cpk, Pp, Ppk, Cpm, Cpk 95 % confidence interval, observed and expected out-of-spec, PPM, Anderson-Darling normality.
CAPABILITY STUDY
The one-page study for the customer or the auditor: specification, indices, histogram against the limits with the normal curve, normal probability plot, normality verdict, a plain-words reading and signature lines. Print it as it is.
ATTRIBUTE LOG + CHART
600 samples of counts charted as p, np, c or u with limits per sample when the sample size varies, and rules 1 to 4.
DASHBOARD
Every characteristic for the period: subgroups, period limits, points beyond, status, Cpk, Ppk, rating against your target, the previous period and the trend; a worst-first list and a Cpk chart against the target.
REVIEW PAGE
The one-pager for the quality meeting: the counts, characteristics below target, out of control this period, the lowest Cpk, signatures.
Two workbooks in the zip, light and dark, plus an Instructions sheet in each. No macros, no array formulas, no add-ins.
Why it earns its price
The free version records. This one runs the process. Three things the workbook does that a log with a logo cannot:
1.Phases: enter the date of a deliberate process change and the limits recalculate from that date; rule windows never straddle a change.
2.The confidence interval says how much of a Cpk is sampling noise, and the normality test says whether the indices can be trusted at all.
3.Every number is cross-checked against an independent calculation on the sample data: limits per phase, all eight rules, the indices, the A² statistic and its p-value.
4.The chart, the study, the attribute chart, the dashboard and the review page are protected without a password: nobody types over a formula, and the pickers, dates and signature lines stay editable. Green tabs are where you type; slate tabs fill themselves.
Start with the free version: SPC Control Chart Pack · Cp/Cpk Calculator. Or see the same records running in the app (read-only demo, no signup).
Free template vs Pro Template
The whole line side by side. Rows that name another template apply to that template.
| What | Free template | Pro Template |
|---|---|---|
| Rows in the log | 200 | 1,000 (60 months in the KPI log), plus a documented way to add more |
| Dashboard | All-time totals | Any month and period, with the previous period, the trend and a rating against your targets |
| Form | A blank one-page form to type into | Fills itself from the log row you pick, with sign-off lines, prints on one page, and is protected so nothing is typed over a formula |
| NCR to CAPA | Two workbooks that do not know about each other | One workbook: the NCR row shows its CAPA status, the 8D reads the part from the NCR |
| Root-cause tools | A separate 5-why / fishbone workbook with headers typed by hand | 5-why, 3-legged 5-why and Ishikawa inside the CAPA workbook, headers filled from the CAPA you pick |
| Quality alert | Its own workbook: log, printable alert, acknowledgement tracking | A register linked to the NCR; the floor copy fills from the NCR row, with a signature table and a BAD / GOOD photo page |
| Read-across | Not on the 8D | Similar parts, processes, lines and sites checked, the action, owner and date, on the log and the 8D |
| Pareto | Plain bar charts | Sorted bars with the cumulative share line, per period |
| Cost | One estimated-cost column (NCR) | Scrap, rework at your rate, sort and other, totalled per NCR and per period |
| Repeat detection | None | Same part and defect inside your window flagged and counted (NCR) |
| Effectiveness | A text column (CAPA) | A due date from the implementation date, a result, recurrence, and a list of what did not work |
| Management review | Not covered | The fourteen 2026 inputs with figures from the KPI log, objectives, actions carried forward |
| Review page | None | One printable sheet per template |
| Dark edition | No | Yes, in every download |
| Control charts | One characteristic per sheet, four rules, one frozen baseline (SPC pack) | One log for 24 characteristics, a selector chart, all eight Nelson rules, limits per phase |
| Capability | Cp, Cpk, Pp, Ppk, % out of spec, histogram (Cpk calculator) | Plus Cpm, PPM, a 95 % confidence interval, Anderson-Darling normality, a probability plot and a study page that prints |
Questions
Is this a subscription?
No. Each template is a one-time purchase and the files are yours. There is nothing to cancel and no account to create. Your receipt carries a link that re-downloads the latest build whenever you like.
Does it work on a Mac, or in LibreOffice?
Yes. The workbooks have no macros and no array formulas, so they open in Excel for Mac, Excel 2010 and later on Windows, and LibreOffice. Google Sheets opens them too, with the usual Sheets limits on conditional formatting.
How is this different from the free templates?
The free workbooks record things. These run the process: the dashboard answers for any month or period against your own targets, the form fills itself from the log, Pareto charts are sorted with the cumulative line, costs and repeats are counted, the effectiveness check falls due by itself, and each template prints a one-page review sheet. Every one also ships in a dark edition.
Can I edit the report sheets?
The sheets that fill themselves (the reports, the alert, the chart and study, the management review meeting minutes, the dashboards, the review pages) are protected without a password so a reader cannot type over a formula by accident. Yellow cells on them still take a signature or a note. To change a value, change the log row; to restyle a sheet, Review > Unprotect Sheet lifts the protection.
Does it come full of someone else's sample data?
No. The workbooks you download carry a handful of sample rows (three NCRs, two CAPAs and one alert; two characteristics with a dozen subgroups; three months of KPIs) so every sheet is seen working, and they clear in a minute. The zip also holds a worked example of each workbook with a year of records from one machine shop, in its own folder, for reference.
Can I add my own KPIs, categories, people?
Yes. Every dropdown reads a yellow list on CONFIG with spare rows. The KPI template has 24 KPI slots, sixteen pre-filled, and each one is yours to rename or retire.
What happens when I pass 1,000 rows?
Select the END OF LOG row, insert rows above it and copy the last row down. Every count, chart and dropdown already reaches that row, so inserted rows are included. The Instructions sheet shows the two steps.
Will it talk to the NominalQC app?
Not automatically. The templates are standalone Excel workbooks. When the log outgrows a spreadsheet, the same records run in the app with multi-user access, reminders and an audit trail; each workbook carries a link to the live demo.
What if it is not what I expected?
Reply to your receipt within 30 days and say so, and you get your money back. No form to fill in.
More Pro Templates
The three-template bundle
All three templates for $49(saves $8)
Past the spreadsheet stage?
The same records run as live screens in NominalQC, with multi-user access, reminders and an audit trail. Free for one user, flat monthly plans for the whole shop.